Welcome to AtSRGA (Arabidopsis thaliana Stress Responsive Gene Atlas)
AtSRGA is a user-friendly application enabling users to retrieve stress-responsive genes in Arabidopsis thaliana. AtSRGA presents stress-responsive genes in a heatmap format based on a stress responsiveness measure (SRscore, see section 2-3 of tutorial). It facilitates the comparative analysis of individual stress responses and groups of genes responsive to multiple stress conditions. Researchers can identify groups of genes with similar patterns by examining the SRscore pattern of a gene of interest across 11 stress conditions. AtSRGA will enhance the screening of biologically significant stress-responsive genes in Arabidopsis in functional genomics research.
Quick start
This section offers a brief explanation and operational steps for the main features of AtSRGA. For more detailed instructions, please click the “Tutorial” tab in the sidebar and download the tutorial file.
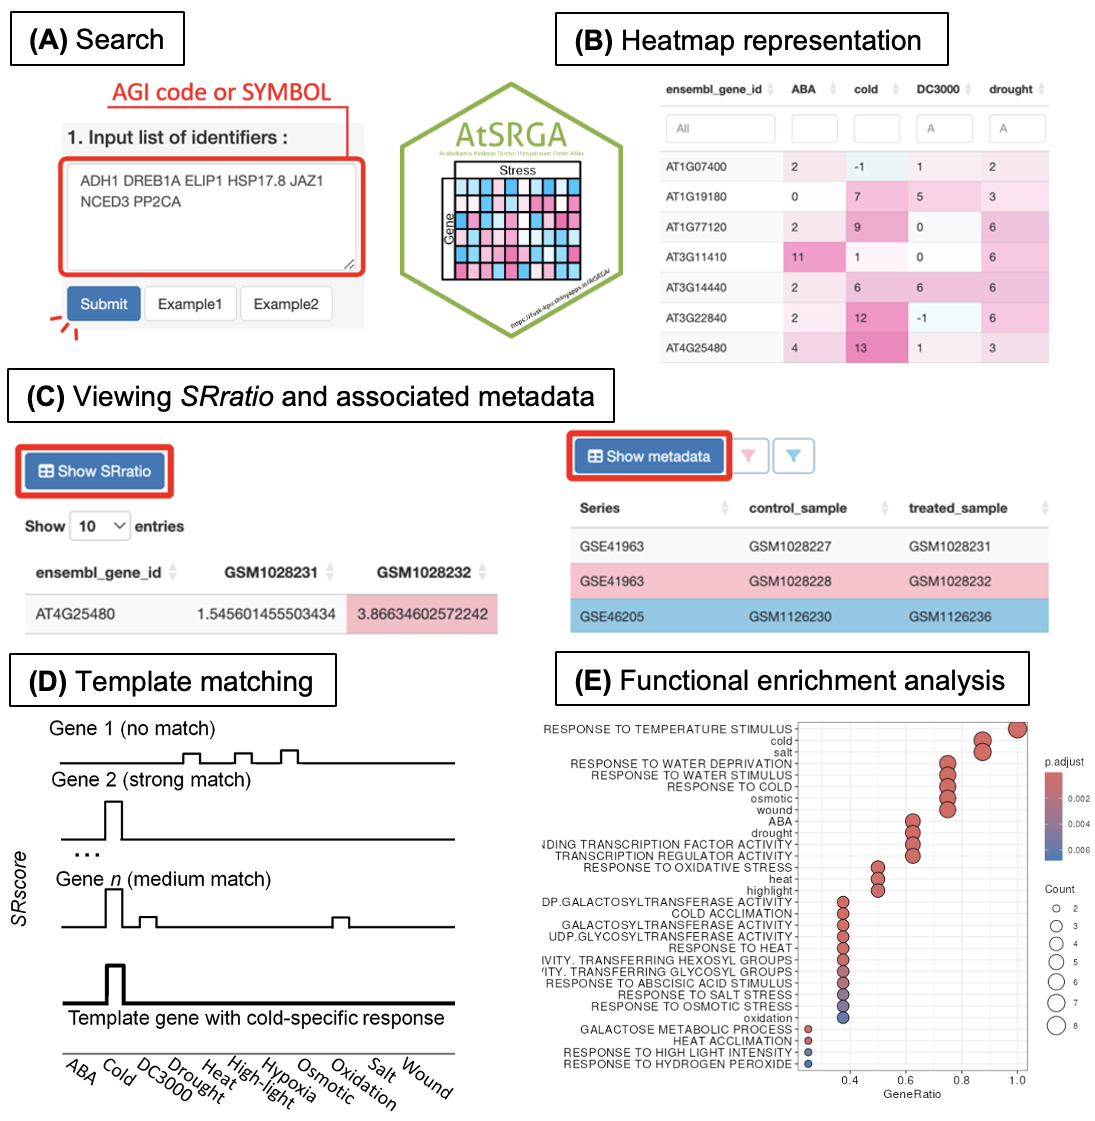
1. Search
Check the SRscore* of genes of interest.
- Click the “Microarray” tab or the “RNA-Seq” tab in the sidebar, then select the “Atlas” tab.
- Enter a list of genes (AGI code or SYMBOL) in the lower-left section of the main screen (if you do not have a list, click the “Example” button).
- Click the “Submit” button to display the atlas corresponding to the entered genes at the top of the screen.
- To reset, click the “Reset Table” button at the top of the main screen.
*SRscore = Stress Response score, representing a consistent tendency of upregulation or downregulation across multiple datasets.
2. Heatmap representation
Output results as a heatmap.
- After completing steps 1-3 above, click the “Plot” button at the bottom of the main screen to generate a heatmap.
- cUse the interface above the “Plot” button to adjust the y-axis label or the height of the heatmap as needed, then click the “Plot” button again to update the display.
3. Viewing SRratio** and associated metadata
Check the experimental conditions under which expression changes occurred.
- After completing step 1-1, click on any row (or multiple rows) in the atlas.
- Click the tab labeled with the name of the stress of interest at the top of the main screen.
- Click the “Show SRratio” button to display the SRratio of the selected gene for each experimental sample.
- Click the “Show Metadata” button to display metadata related to the selected stress.
- Click any row in the table at the top, then click the “Show Metadata” button again to display metadata with color-coded experimental samples where the SRratio is ≥2 or ≤-2.
**SRratio = Expression ratios under stress and control conditions.
4. Template matching
Find genes with similar SRscore patterns.
- After completing step 1-1, click on any row in the atlas.
- Click the “Template Matching” tab in the sidebar.
- Click the “Plot” button to generate a heatmap of matching genes.
- Use the interface above the “Plot” button to adjust parameters, such as the distance calculation method, number of matching genes, y-axis label, or heatmap height, as needed. Click the “Plot” button again to update the display.
5. Functional enrichment analysis
Interpret biological functions.
- After completing step 1-3, click the “Analysis” button in the lower-right of the main screen to start enrichment analysis based on gene sets defined by Gene Ontology and KEGG.
- Once the analysis is complete, a dot plot will appear at the bottom of the main screen.
- Use the interface below the “Analysis” button to adjust parameters, such as the x-axis label, the number of displayed items, the number of characters per line break, or the height of the dot plot as needed.
- Optionally, use the interface above the “Analysis” button to include our customized gene sets for further analysis.
6. Links
Use external genome-wide resources.
Each gene listed in AtSRGA is annotated with links to external genome-wide resources, such as TAIR and KEGG, facilitating seamless data analysis and development of a hypothesis. The links exist on the far right side of the Atlas main screen.
Overview
Template Matching → Heatmap
1. Select a gene in overview
2. Control paremeters of heatmap
Template Matching → Heatmap
1. Select a gene in overview
2. Control paremeters of heatmap
Tutorial
For more detail infomation and operating instruction, please see our tutorial video or document.
Video
English :
https://drive.google.com/file/d/1qA9YYD2w9aagal1EcCQQTLyaKZ5aUO4T/view?usp=sharing
Japanese :
https://drive.google.com/file/d/1SKn6xVJxjnq2P9tG5cb8UHUoTWg564qA/view?usp=drive_link
Document
English :
https://github.com/fusk-kpu/StressResponseGenesAtlas/raw/main/AtSRGA_tutorial_en.pdf
Contact us
To get in contact with our group, please visit our laboratory's website.
Report bugs
The R code for this application is available on Github.
To report bugs and/or request features, please post issue on github.
Citation
If you find AtSRGA useful, please consider citing our publication :
Yusuke Fukuda, Kohei Kawaguchi, Atsushi Fukushima "AtSRGA: A shiny application for retrieving and visualizing stress-responsive genes in Arabidopsis thaliana," Plant Physiol in press.
https://doi.org/10.1093/plphys/kiaf105 .
https://doi.org/10.1093/plphys/kiaf105 .